Monitor and Optimize Email Campaign Analytics in Nudge
In this video, we will take you through the Analytics section in Nudge — so you always know how your emails are performing and what to do next.
Overview of Analytics Section
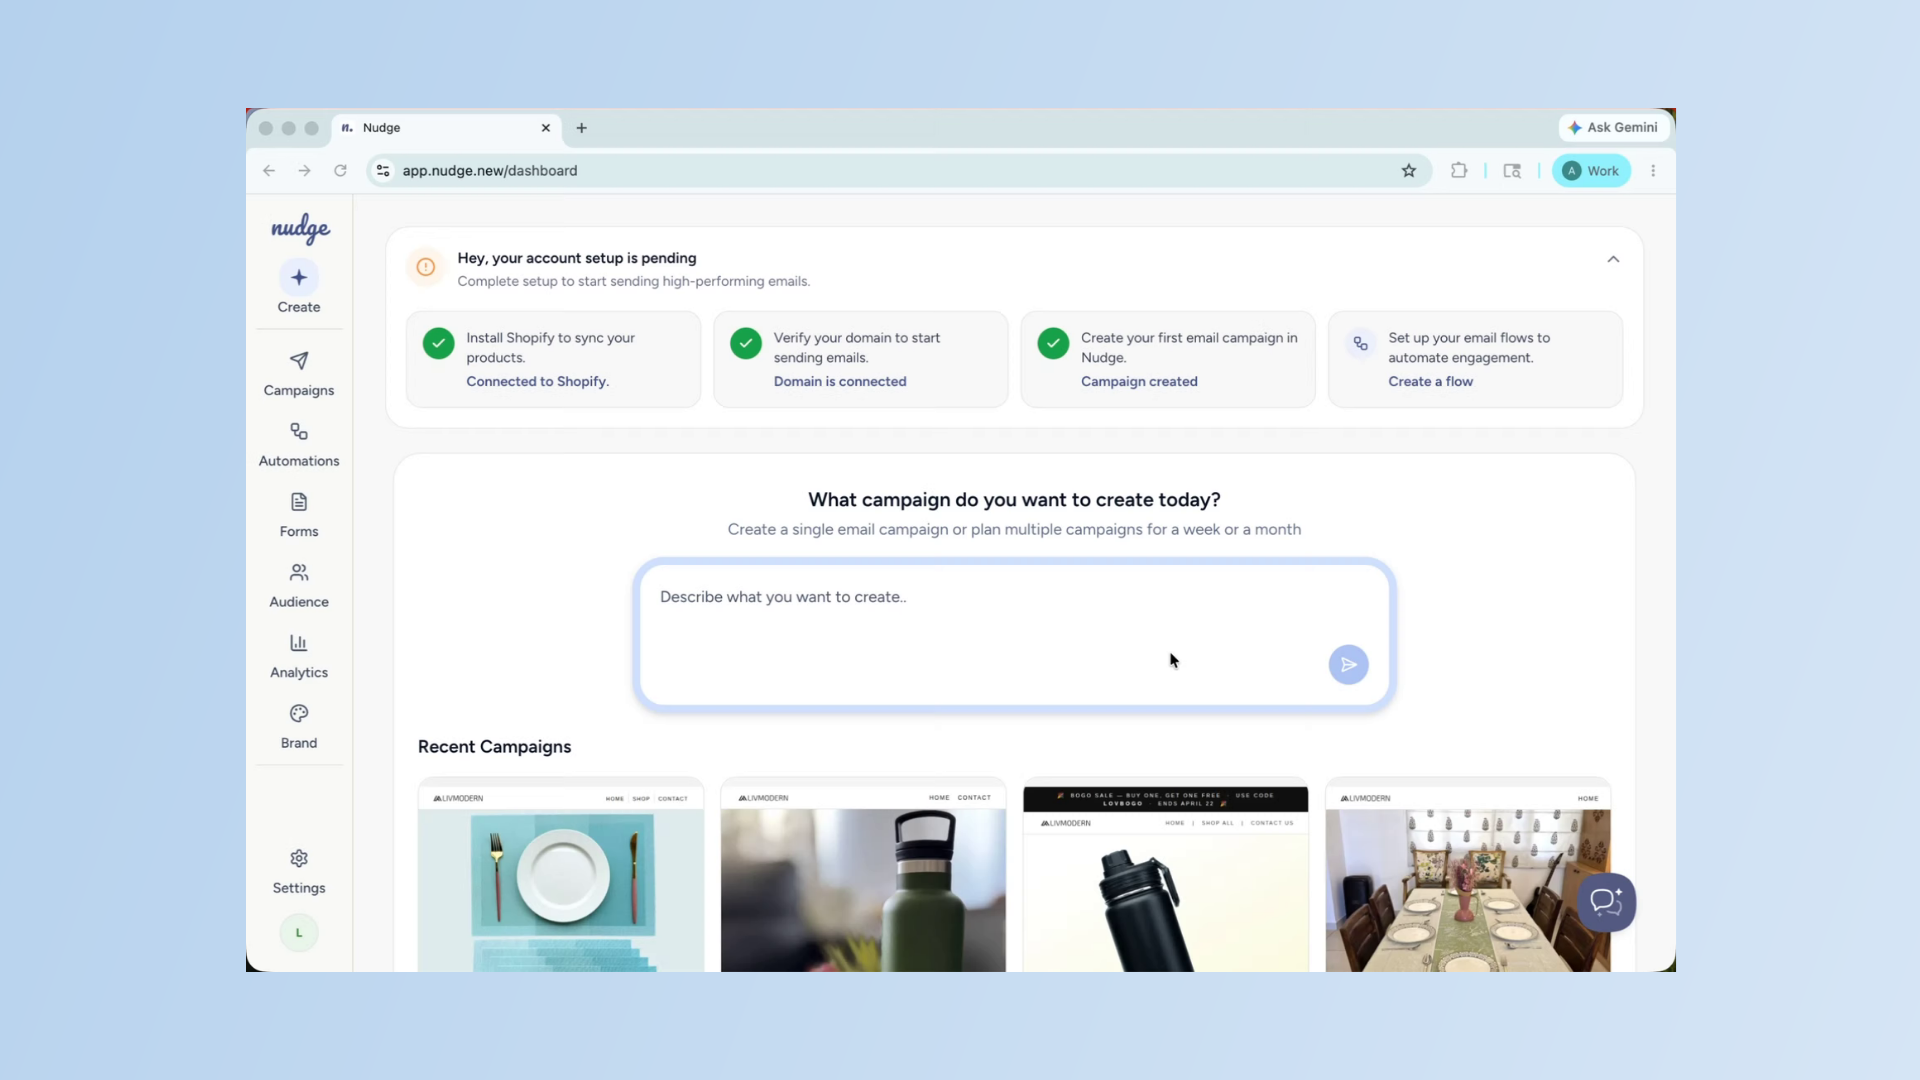
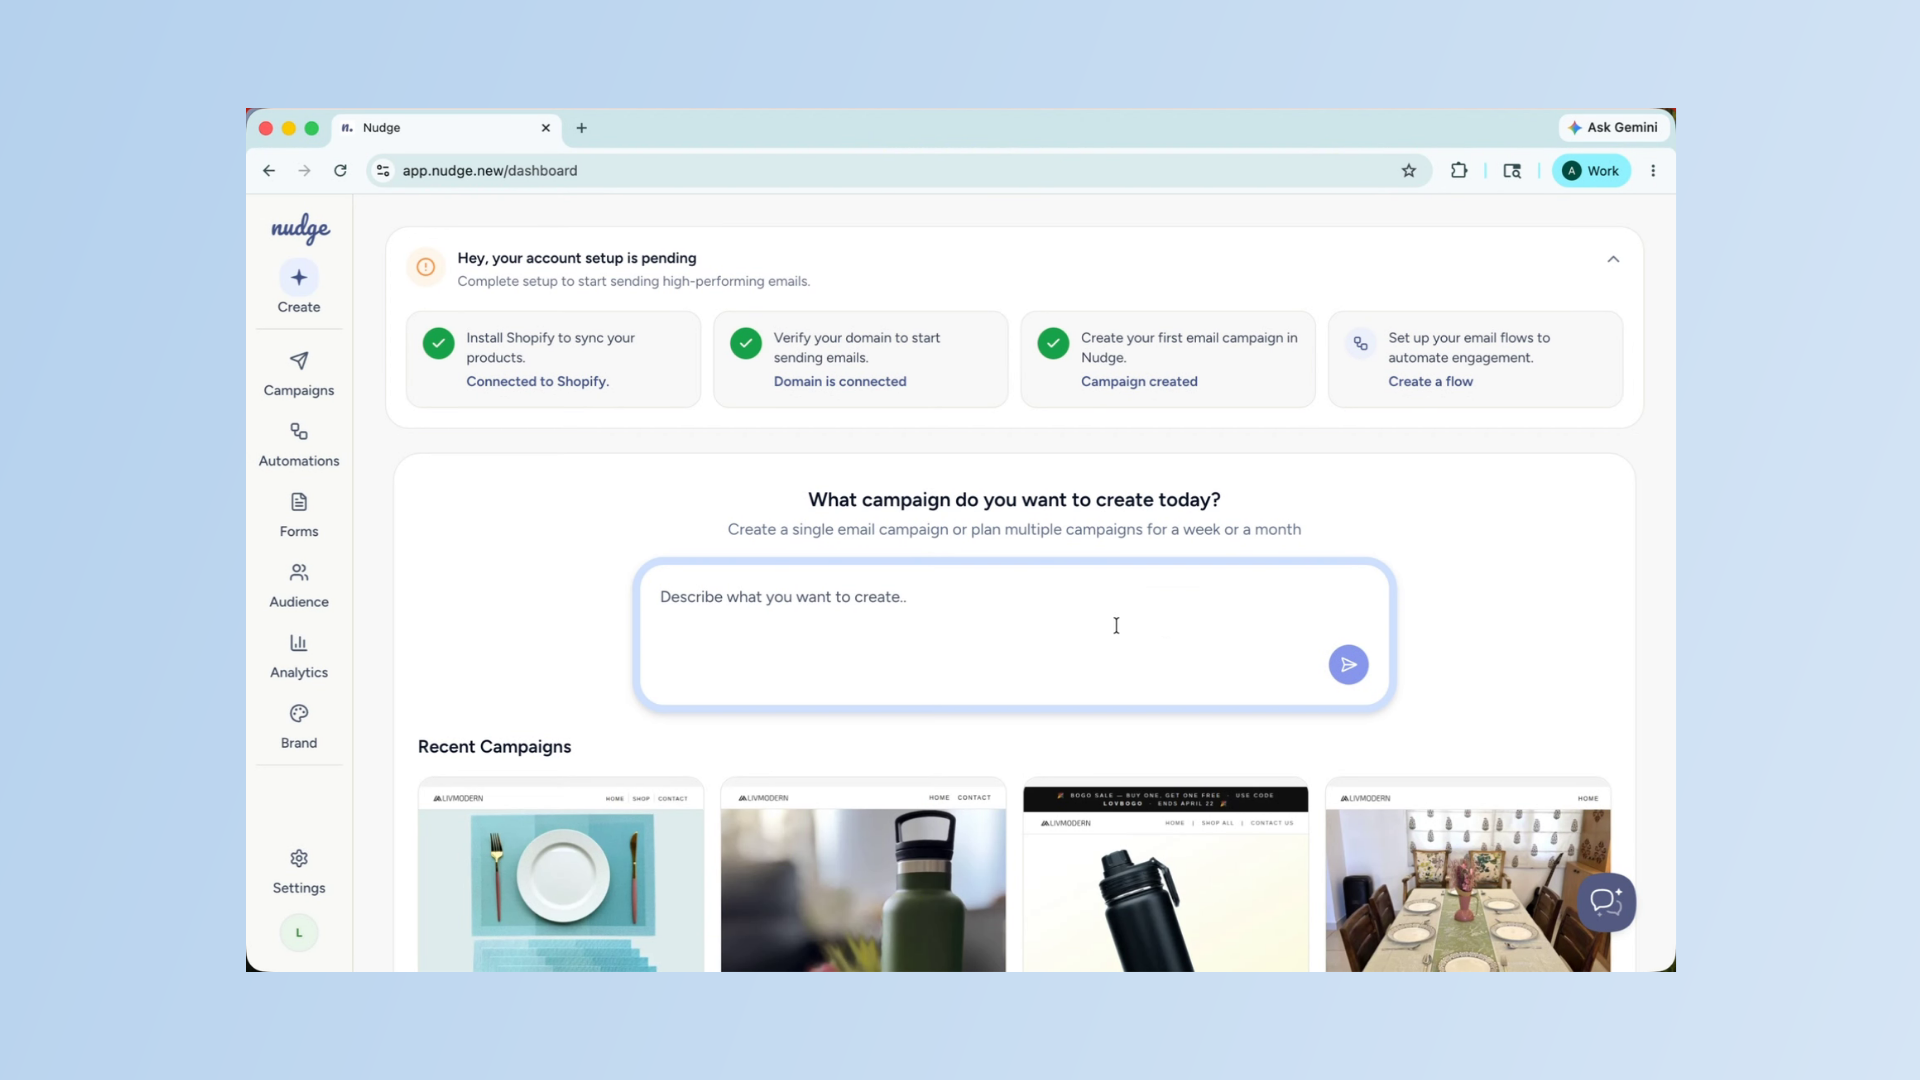
Once your campaigns and flows are running, the Analytics section becomes one of the most important places in your account. It tells you what is working, what needs attention, and where your next win is hiding. Let's walk through it together.
Navigate Analytics Dashboard Tabs
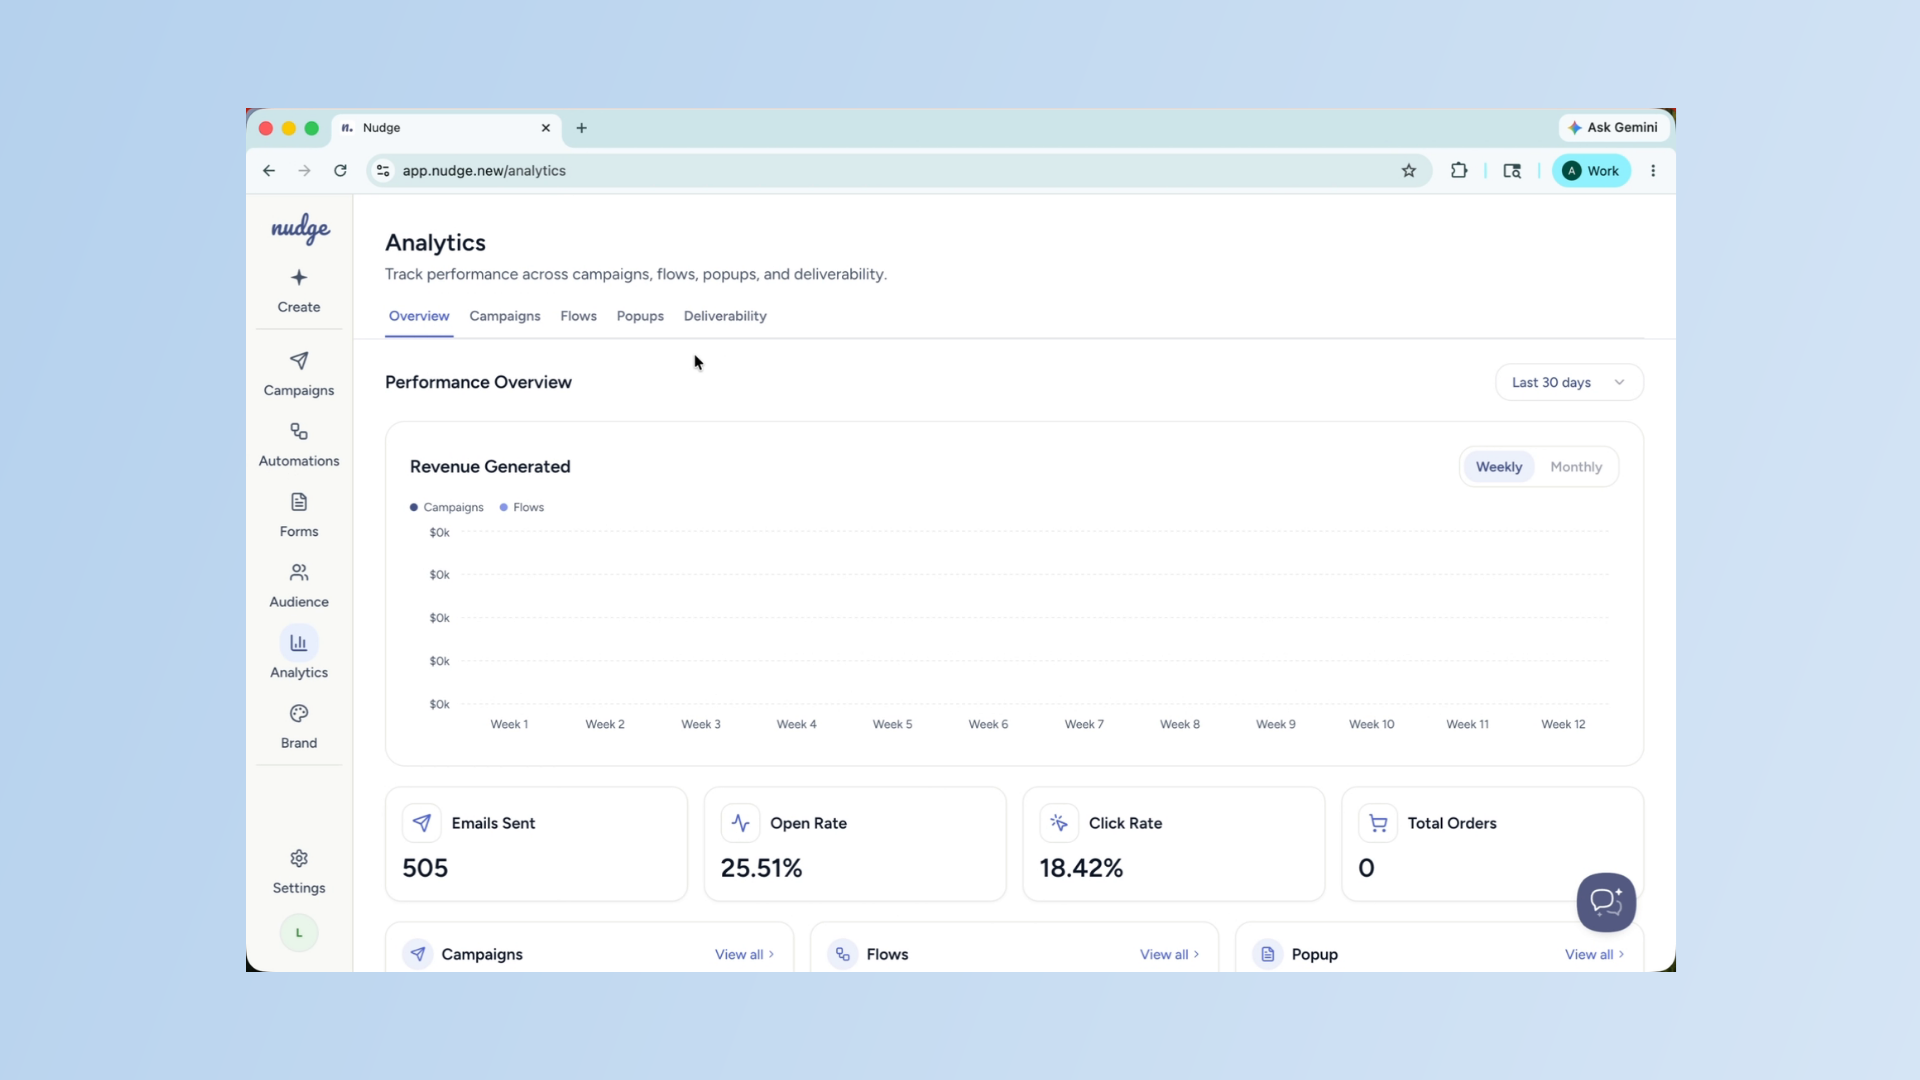
From the dashboard, click on Analytics in the left panel. You will see four tabs at the top — Campaigns, Flows, Popups, and Deliverability. Each one gives you a focused view of that part of your marketing. We will go through each one.
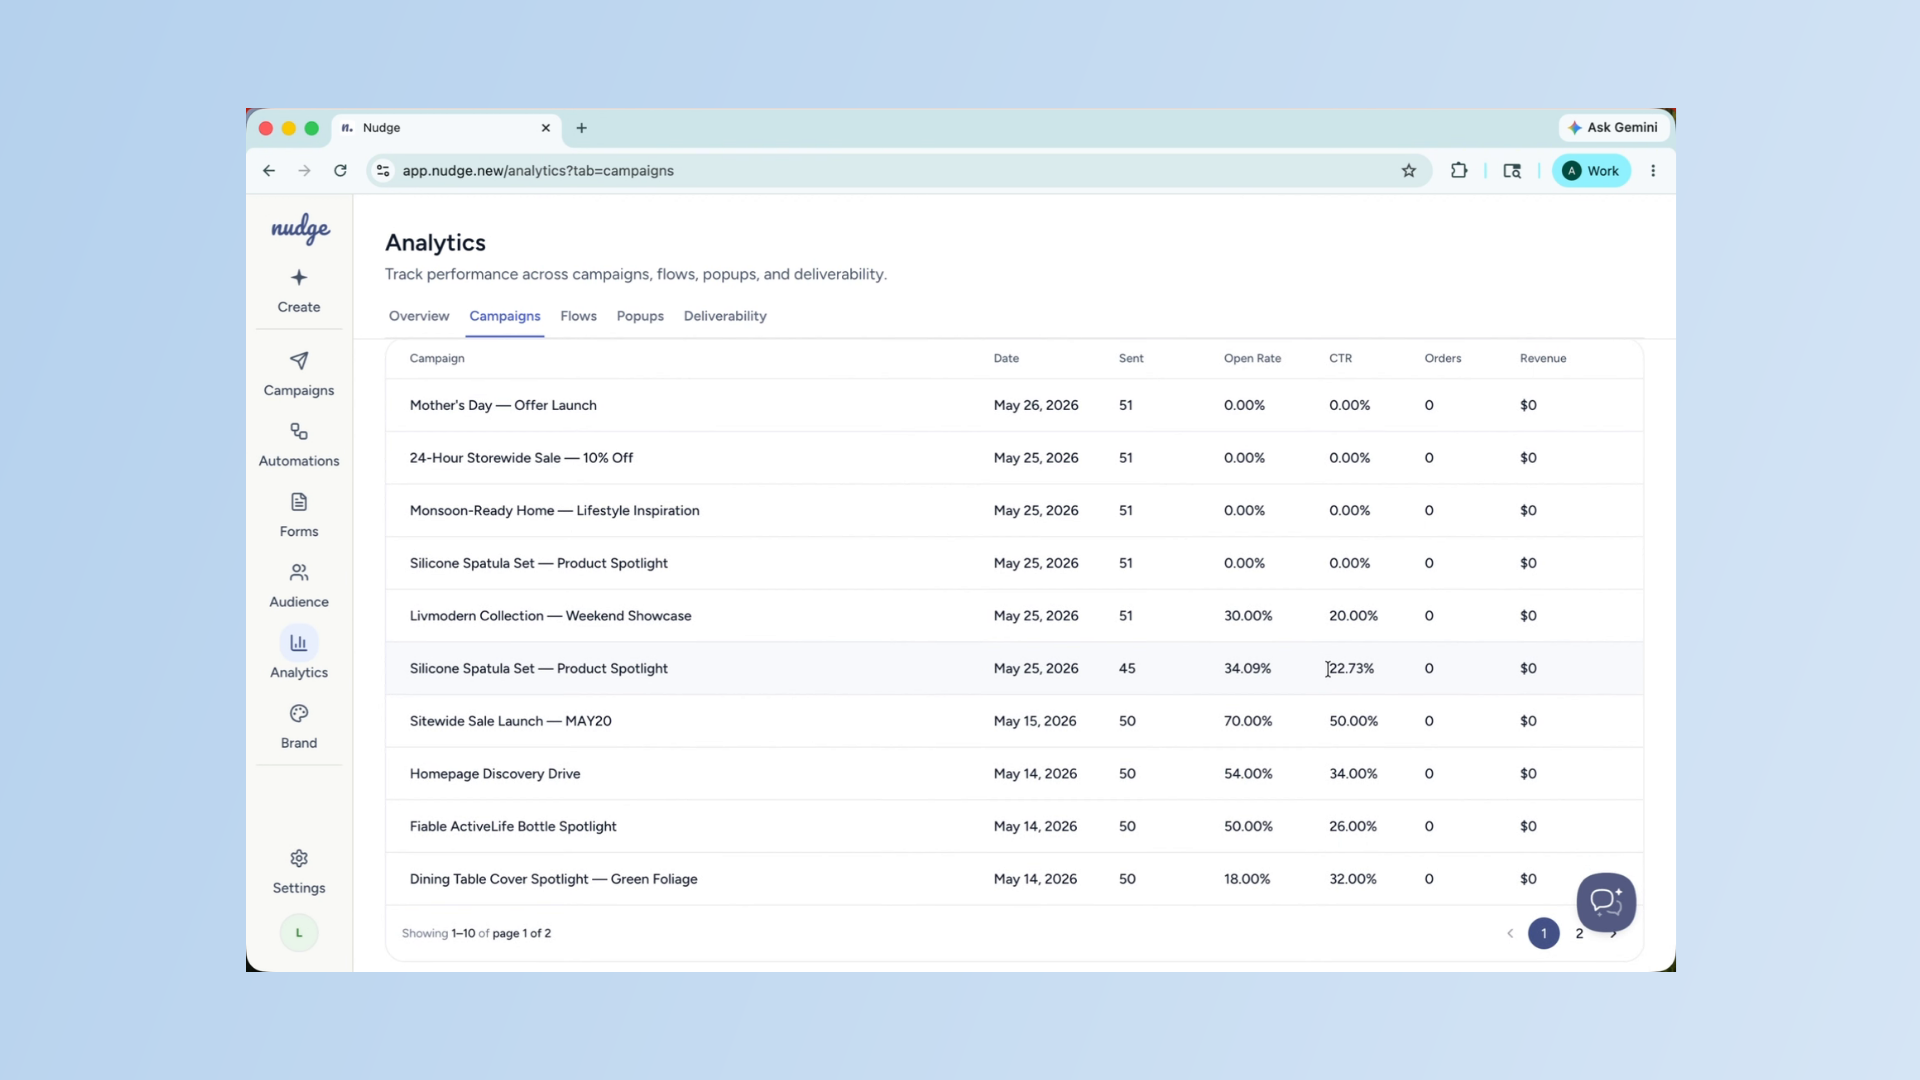
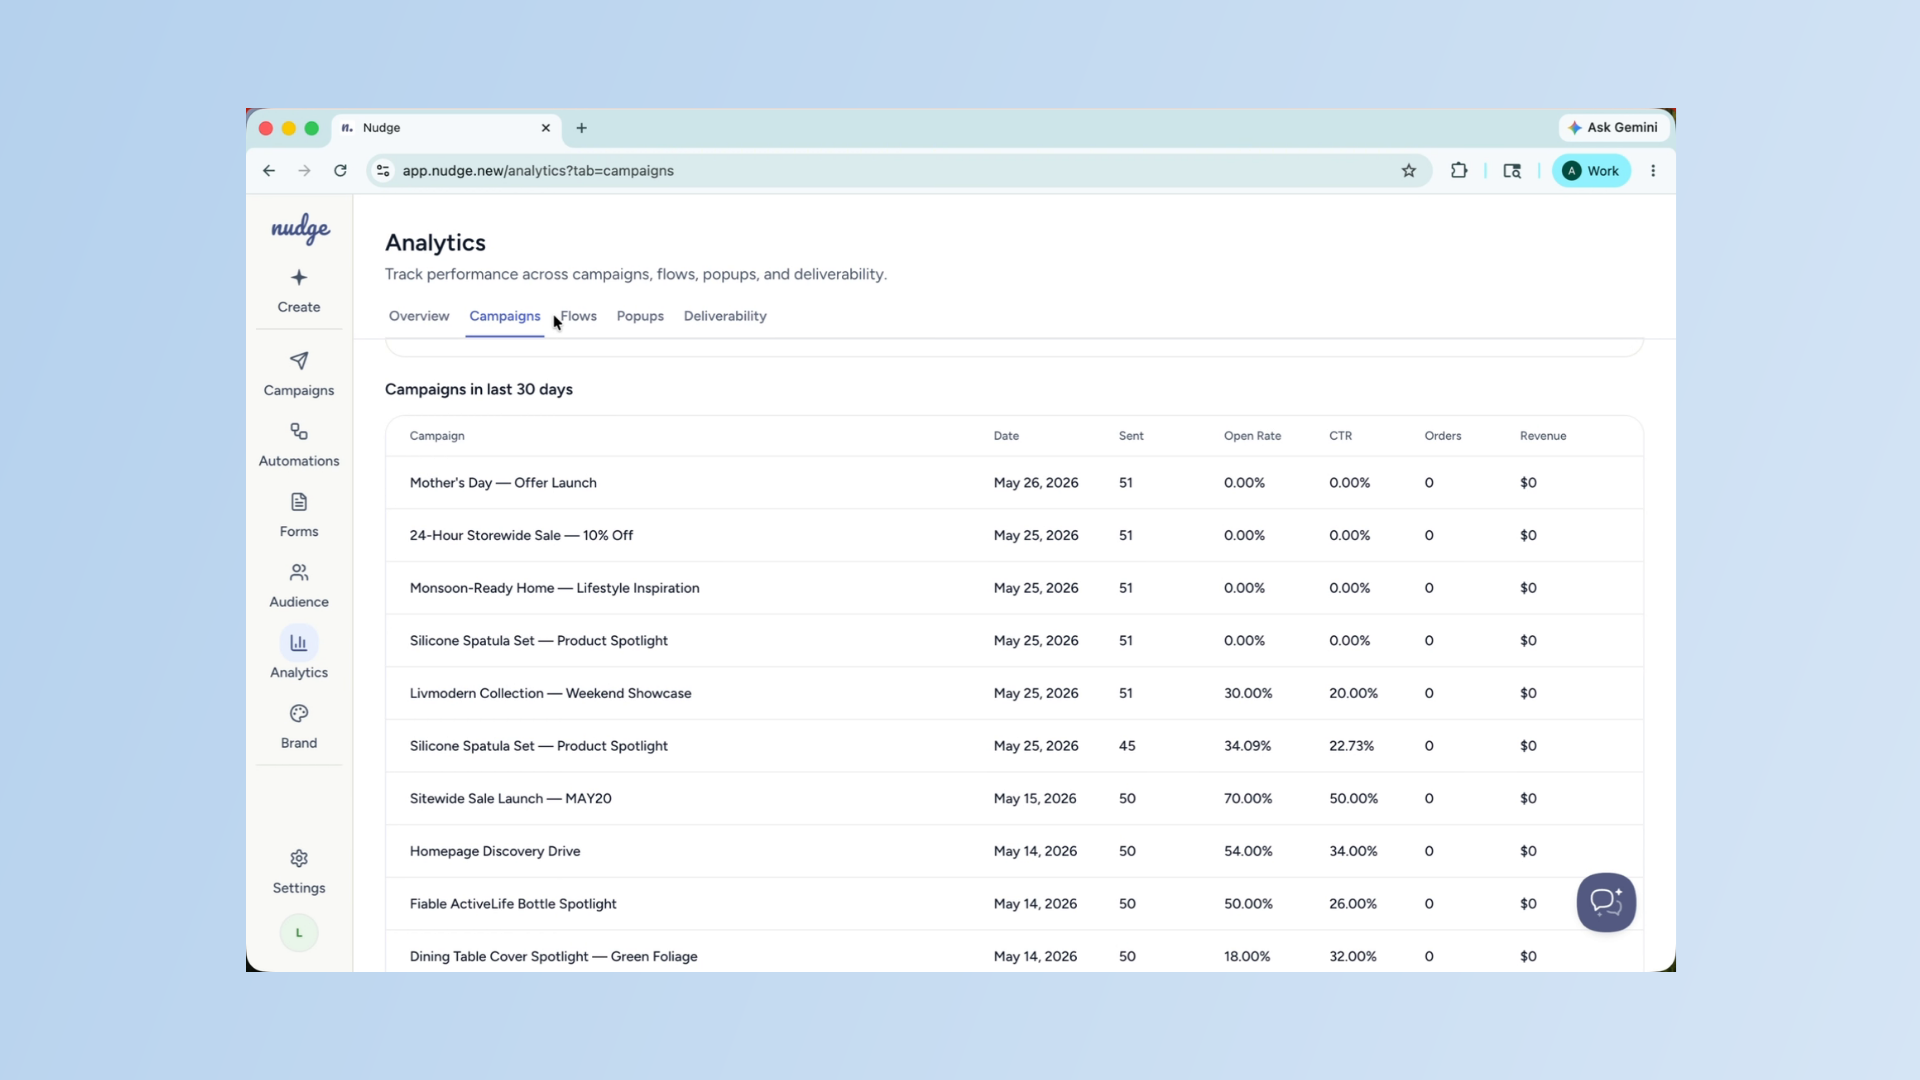
Access Campaign Analytics Tab
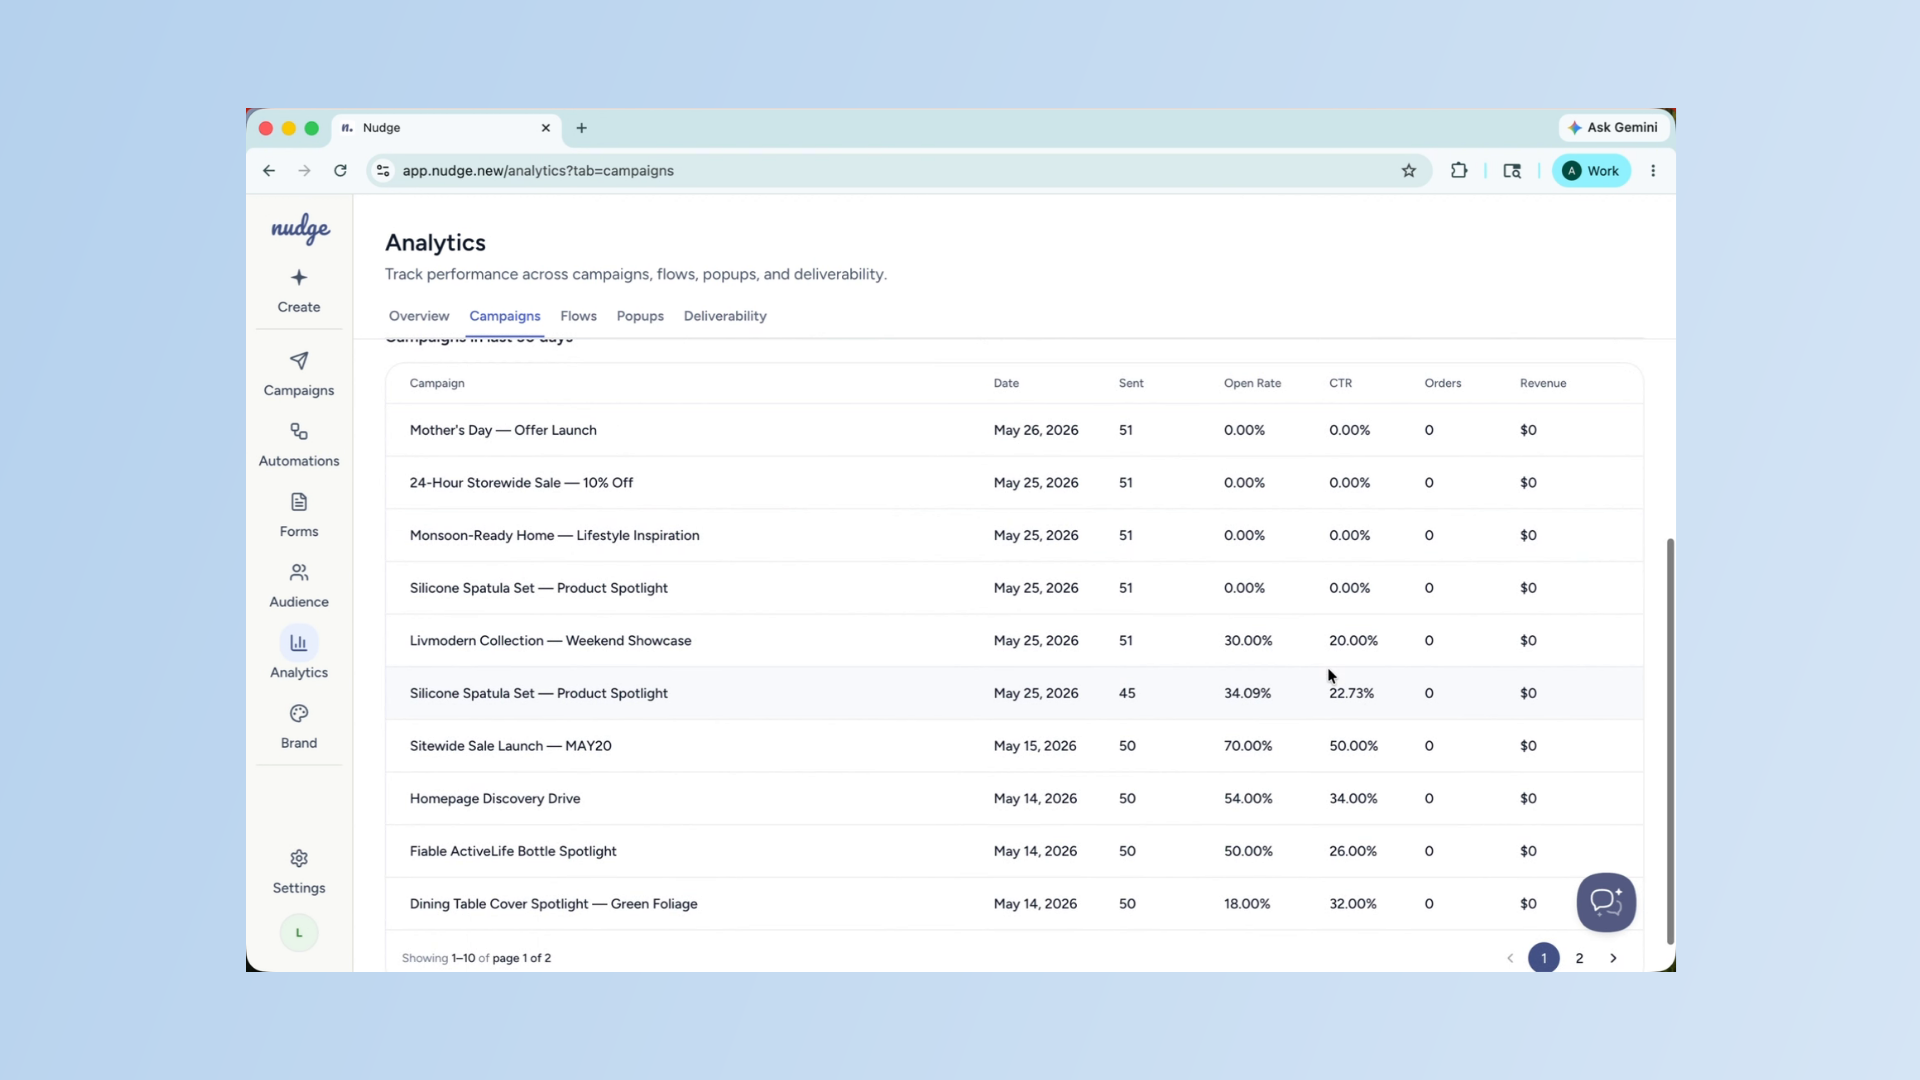
Click on the Campaigns tab. Here you will see a breakdown of every campaign you have sent — open rate, click rate, and the number of recipients. Your open rate tells you how compelling your subject line was.
Importance of Open and Click Rates
Your click rate tells you how well the email content and call to action performed. A healthy open rate for e-commerce, sits between 25 to 35%. Anything below that is usually a subject line issue.
Improve Campaign Performance
If your open rate is low, the first thing to test is your subject line. Keep it short, benefit-led, and specific. If your click rate is low, look at the email itself — is there one clear call to action? Is it visible without scrolling? These two numbers together tell you a lot about where to focus your energy.
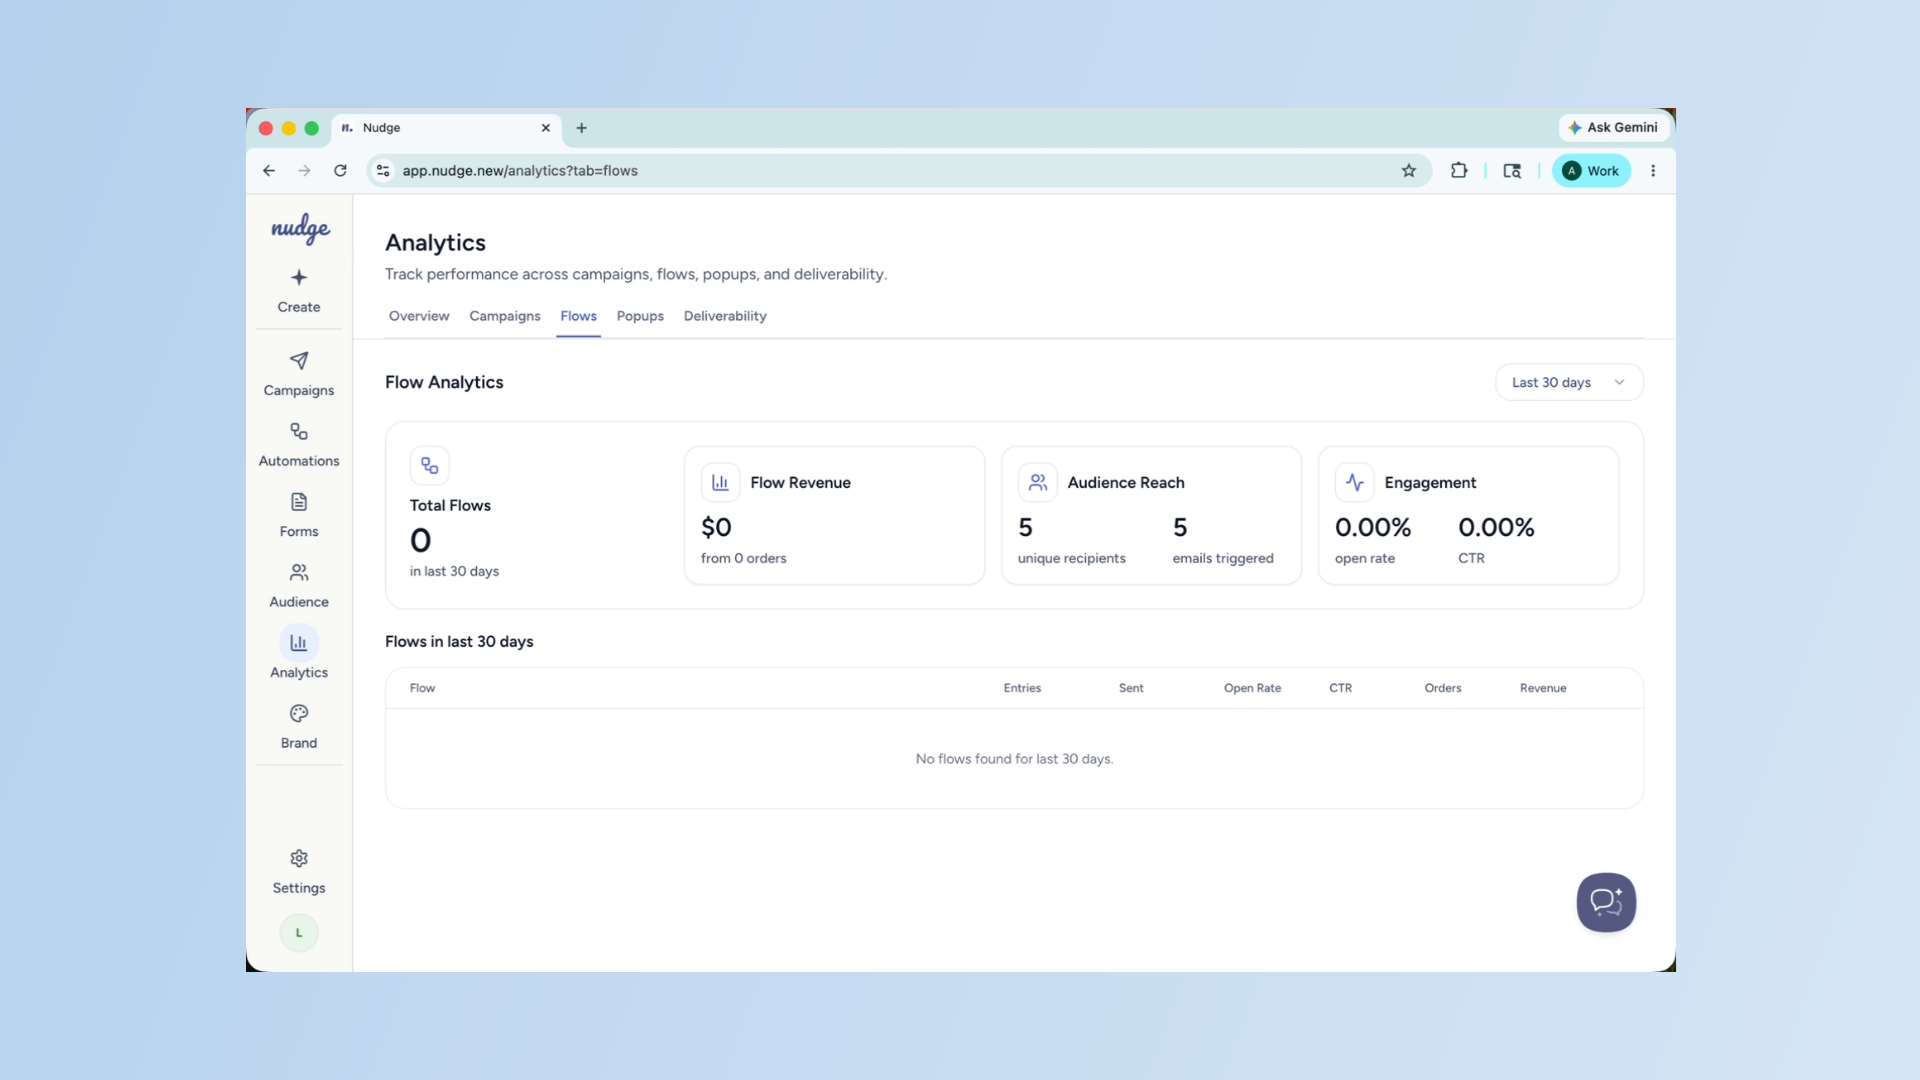
Review Flows Tab Insights
Head over to the Flows tab. Here you can see how each automated flow is performing, and drill down into individual emails within a flow. If one email in your Welcome sequence has a significantly lower open rate than the others, that is a signal to revisit the subject line or the timing. Small tweaks to individual emails in a flow can have a big impact on overall performance.
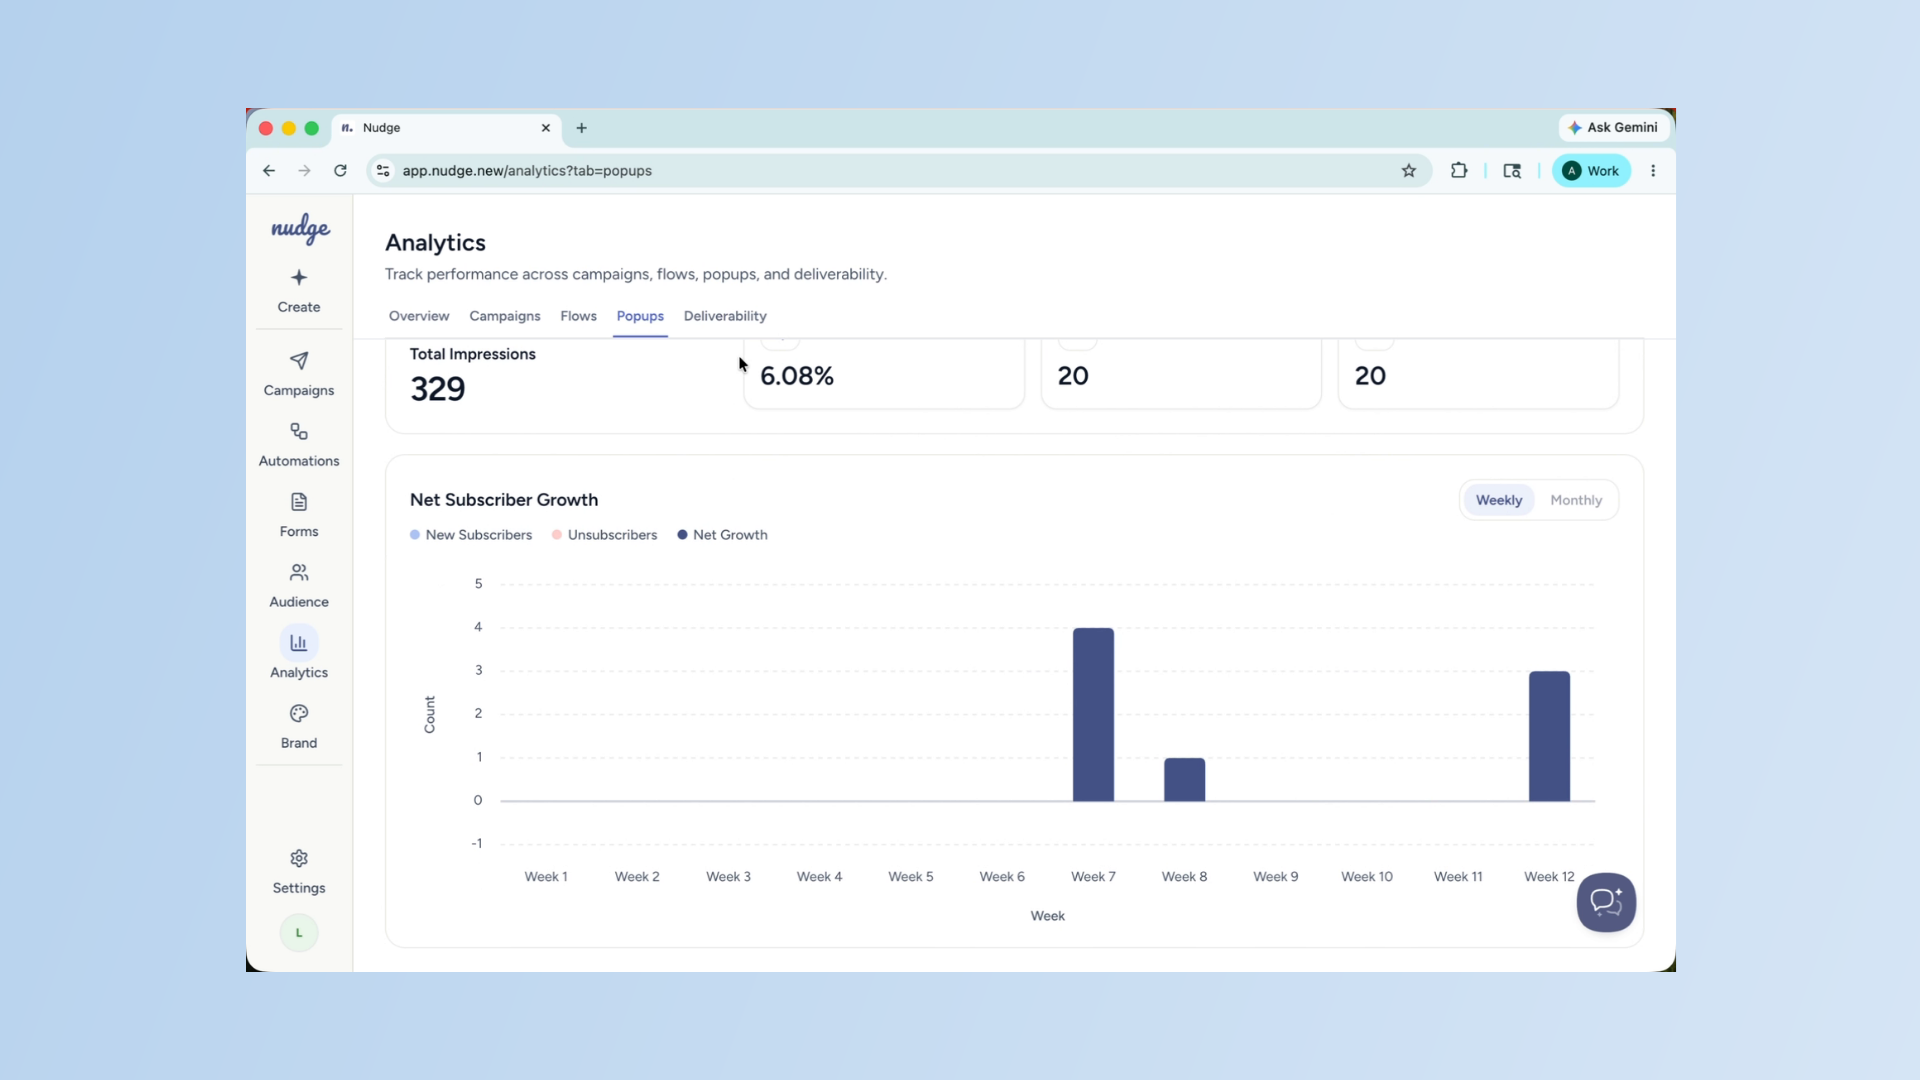
Analyze Pop-Up Conversion Metrics
The Popups tab shows you how your forms are converting. The key metric here is your submission rate — the percentage of visitors who saw your pop-up and signed up. If this number feels low, try testing a stronger offer, a shorter form, or adjusting the trigger timing. Sometimes showing the pop-up a few seconds later makes a meaningful difference.
Monitor Deliverability Metrics
The Deliverability tab is one to check regularly, especially as your sending volume grows. It shows your bounce rate, spam complaint rate, and overall sender health. Keep your bounce rate below two percent and your spam complaint rate below 0.1 percent. If either is climbing, it is worth cleaning your list and reviewing how often you are sending.
That is a full walkthrough of the Analytics section. Make it a habit to check your numbers after every send and look for patterns over time. The more attention you pay to your data, the better your campaigns will get. See you in the next one!